Using the built-in views provided in the logging database, you can review the different metrics that are captured in the SharePoint usage and health collection intervals. This information not only can be viewed in SSMS but can also be exported as a comma-separated value (*.csv) file to Microsoft Excel for further analysis.
SharePoint farm administrators are becoming more and more versatile. One of the key toolsets we are learning to master is the simple SSMS tool. Understand how to connect to a server, run a simple query, and view the result.
To begin viewing logging data in SSMS, do the following:
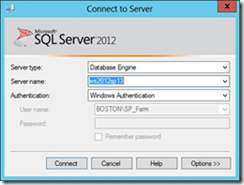
1. Open SSMS and connect to the SQL instance providing data services to your SharePoint farm (see Figure 1).
FIGURE 1 Connecting to a server.
2. Select the logging database and then select the plus (+) sign to show all its components (see Figure 2).
FIGURE 2 Expanded logging database.
3. Next, select a view for which you want to collect information (see Figure 3).
FIGURE 3 Choosing a view
4. Right-click the view and choose Select Top 1000 Rows (see Figure 4).
FIGURE 4 Selecting the top 1,000 rows.
5. The SQL Query appears in the top pane, and the lower pane shows the query results (see Figure 5).
FIGURE 5 T-SQL query and results.
6. These results can now be exported to a *.csv file for viewing and analysis in Microsoft Excel. To begin, right-click the results window and choose Save Results As (see Figure 6).
FIGURE 6 Saving results.
7. Choose a file name for the *.csv file and select Save (see Figure 7).
FIGURE 7 Choosing a name for the *.csv file.
8. Opening and importing the *.csv file in Excel enables you to display and interact with the data (see Figure 8).
FIGURE 8 Usage and health data in Excel.

![image_thumb[1] image_thumb[1]](https://blogger.googleusercontent.com/img/b/R29vZ2xl/AVvXsEjW4pLxMhqzwv9sX_5I7-QXK3lkZGS17r8a2tzQKY3D_qJI58NrY_0xynGHw3VXUSThvPeVSxfo4X1vfPU2gIRbnTywfOQKutRzx9ElSbg_cAKH5nPsG2OvLIFqsteFA6KSQXPLhrZGu74/?imgmax=800)
![image_thumb[2] image_thumb[2]](https://blogger.googleusercontent.com/img/b/R29vZ2xl/AVvXsEgJBEpJW7IWzQ_giZTpnASZxHDMWoe-Y0ZIV5iYnrvH82ULRlWpc0zxVIXZfN6zdA8LR3IKqHpJSRJtPRu_th_10HXvJHHyizg6VM_3RM6bkfp5y4x4M-CK-p-s7sMe5QCP_eqHMJ-v-10/?imgmax=800)
![image_thumb[3] image_thumb[3]](https://blogger.googleusercontent.com/img/b/R29vZ2xl/AVvXsEj5g3A-1-iWS6gQHG0r7e0HePdgpzLbw1C9aTrnQoHxIm72mlckBQmMqAaRJqArsnT1srUabo0-ggxO_GCajXp5a6ausmQnTjHnIWshW9eMlLK-CjlmjCpj5AsIDyiASKISoU6-ul2i_oI/?imgmax=800)
![image_thumb[4] image_thumb[4]](https://blogger.googleusercontent.com/img/b/R29vZ2xl/AVvXsEgs5Ole2ILYG09VHvzaNXUjaLPkNkEJ00nWw6nv8n0zFFGbMCZA0956-j9g2fJCEbERsryBtu-piWIa5ppELxsyCvQIeqznM7mFP3EGclPjqkDXLpAwZC9PON5rZM70yOOWLyJgBhxtvlI/?imgmax=800)
![image_thumb[5] image_thumb[5]](https://blogger.googleusercontent.com/img/b/R29vZ2xl/AVvXsEhSRzKHvZKXEeVdnRKxXjRaOhwuSvbxmU2Hw2FpMRWevuHbovz9PpyKBw3uaGi205c8U1YGGSal4oFzJtvfDU8BZ46S1Ymjc3kP4fY752Hq3Lu6S0eoirzriJT2MYrRuTb45UuCblVVTr0/?imgmax=800)
![image_thumb[6] image_thumb[6]](https://blogger.googleusercontent.com/img/b/R29vZ2xl/AVvXsEjOAgYUQy3ENZLym3xQMSsbvlY5ZqG2L9Ou6_ExDuIhMFFmxGzwqOZQnuTgKSnmvzVxUhu-KQHuXD6rgsiENZfVPb9CgBKI9XzFgUGIl2CrpFrGR0wUEMF1DrS1EgX7NrcjgbKBydYqKi8/?imgmax=800)
![image_thumb[7] image_thumb[7]](https://blogger.googleusercontent.com/img/b/R29vZ2xl/AVvXsEhCvJelMquaTEbShCEymWOkCbxRxBk_vZZzGQHFc5C46QnL7phOdoJxQ7CAFRX8mnd2k3AyOFbK9Wkaa6aO6wp50KhBwZApTCHPR9iPtM9mZVxSUfCL_8N66PRGambn9m6eb9Xrk3kR3Fs/?imgmax=800)