The Developer Dashboard is a tool that can be used to analyze the performance of your SharePoint pages. When enabled, this tool can be used by anyone having the Add and Customize Pages permission level (or greater).
Interaction with the Developer Dashboard
In SharePoint 2010, the Developer Dashboard appeared on the same page as one it was monitoring. This had a couple of unintended side effects: It reduced the amount of real estate available to view the page and it also could interfere/be interfered with by the master page.
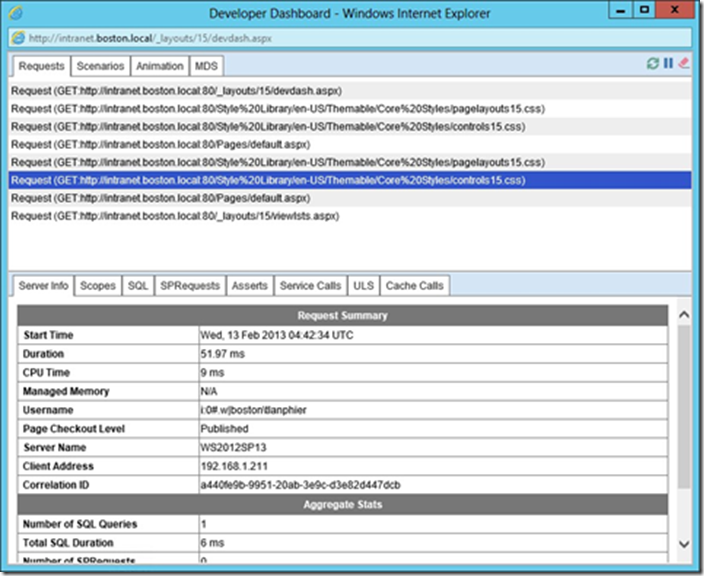
The new Developer Dashboard now appears in its own browser window, making it easier to interact with and navigate to the desired SharePoint page while still providing a dedicated view into the performance of that page.
Developer Dashboard settings
In the previous version of SharePoint, there were three properties for the Developer Dashboard: Off (default), On, and On Demand. When the Developer Dashboard was set to On, it was constantly on the bottom of the screen. When the Developer Dashboard was set to On Demand, you had to select an icon to cause the Developer Dashboard to appear on the screen.
In SharePoint 2013, all three properties still exist in Windows PowerShell, but there are truly only two settings: Off and On. When you specify On, you are really specifying On Demand because you must select the Developer Dashboard icon in the ribbon to cause it to appear. If you choose On Demand, you receive the same result.
“The Developer Dashboard is an indispensable tool for a SharePoint troubleshooter, especially because it can retrieve correlation IDs and their meaning from the back-end server. Understand how to enable this tool via Windows PowerShell and also how to activate/deactivate/use this tool at a basic level.”
Enabling Developer Dashboard using Windows PowerShell
Although you can still use stsadm to activate Windows PowerShell, doing so does not let you exercise more fine-grained control (such as altering the permission level required to view the dashboard) and is quite a bit slower.
To enable the Developer Dashboard, you have to set a variable for the Developer Dashboard Settings object and then change its Properties:
$devdash=[Microsoft.SharePoint.Administration.SPWebService]::ContentService.
DeveloperDashboardSettings
$devdash.DisplayLevel = "On"
$devdash.Update()
To reverse the change, all you have to do to disable it is to set the DisplayLevel property to a value of Off and then do another Update().
Activating Developer Dashboard from a SharePoint page
When the Developer Dashboard is enabled, a new icon appears on the header to the right of Share, Follow, Sync, Edit, and Focus on Content links, as shown in Figure 1.
FIGURE 1 Developer Dashboard icon.
When this icon is selected, the Developer Dashboard appears in a new browser window. Selecting any of the HTTP GET Requests displays the overall metrics required for the particular page to be rendered, as shown in Figure 2.
FIGURE 2 Developer Dashboard.
