Immediately after the implementation has been finalized, you have an opportunity to define the baseline performance of your SharePoint environment.
At this point, we are not talking about performance testing (what the system is capable of when it is working at maximum capacity) but rather what the nominal or expected operation of the system looks like from a logging standpoint.
The optimal goal is to have a statistical sampling of what the environment looks like as it adjusts to varying levels of user demand on a regular interval. For instance, odds are that a system is much busier at 09:00 on Monday than it is at 21:00 on Saturday (assuming a standard work week).
Baselining your SharePoint environment
In a SharePoint farm, there are three distinct tiers that should have a defined performance baseline:
Web tier Items to be monitored can include these:
- Operating system metrics (processor, memory, network interface, and storage)
- IIS metrics (process and ASP.NET metrics)
Application tier Items to be monitored can include these:
- Operating system metrics (processor, memory, network interface, and storage)
- IIS metrics (process and ASP.NET metrics)
- Specific service application metrics (for functionality such as Excel Calculation Services, User Profile Services, and so on)
Data tier Items to be monitored can include these:
- Operating system metrics (processor, memory, network interface, and storage)
- SQL-specific counters (general statistics, user connections, and so on)
Performance Monitor baseline captures
Although it is entirely possible to create and execute performance captures on an ad hoc basis, doing so does not give the retrieved metrics any consistency.
What used to be a fairly complex process of building the PerfMon capture and then scheduling it using an “AT” job is much easier in the newer versions of Windows Server.
The process of building a baseline performance monitor job consists of the following steps:
1. Build a data collector set.
2. Populate the data collector set with the desired performance counters to be retrieved and a desired sampling interval.
3. Choose a desired storage location on the file system.
4. (Optional) Save the data collector set as a template for use on your other systems.
5. Create a series of schedules during which the PerfMon captures are to be run.
“PerfMon is one of the most misunderstood and underutilized tools in Windows Server. Understanding not only how to capture point-in-time metrics but also how to capture a performance baseline over time is a must-have skill for an experienced SharePoint farm administrator.”
Creating and scheduling PerfMon baseline captures
The following example builds a very basic data collector set, saves the set as a template for use on other systems, imports and utilizes the template on a new system, and finally schedules the performance counter captures.
To begin, let’s first build the PerfMon data collector set, as follows:
1. Open Perfmon.exe.
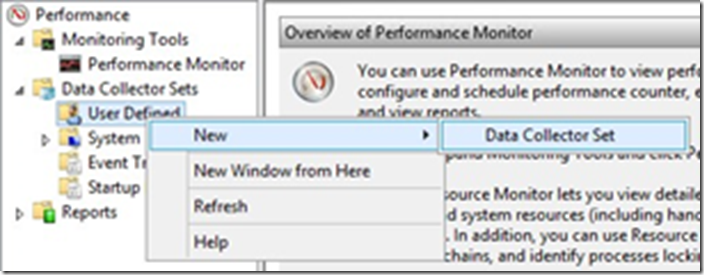
2. Expand the Data Collector Sets section; from the New menu, select Data Collector Set (see Figure 1).
FIGURE 1 New data collector set.
3. On the Create New Data Collector Set page, select Create Data Logs and then select Performance Counter.
4. Click Next (see Figure2).
FIGURE 2 Creating data logs (performance counter).
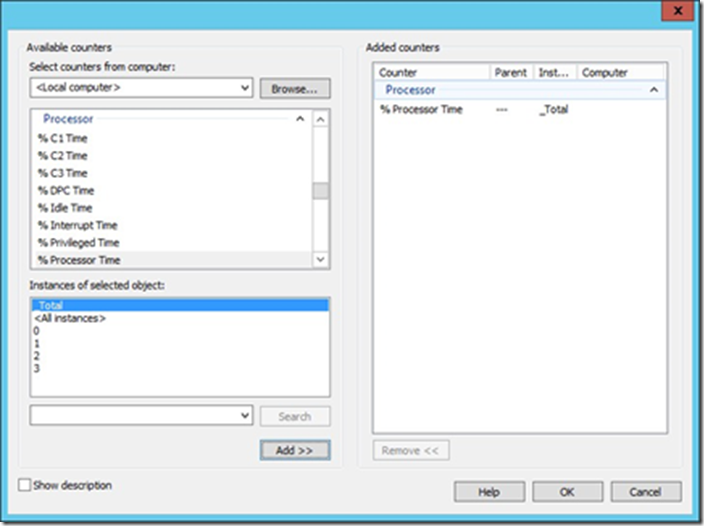
5. Select the Add button to begin the process of selecting a sample performance counter (see Figure 3).
FIGURE 3 Adding performance counters.
6. Select only a single counter in this example:
A. % Processor Time (shows processor usage over time)
7. Click OK to continue (see Figure 4).
FIGURE 4 Example counter.
8. The selected counter is displayed next. You might consider changing the sample interval (the time between counter samples is set to 15 seconds by default). Click Next to continue (see Figure 5).
FIGURE 5 Example counter added.
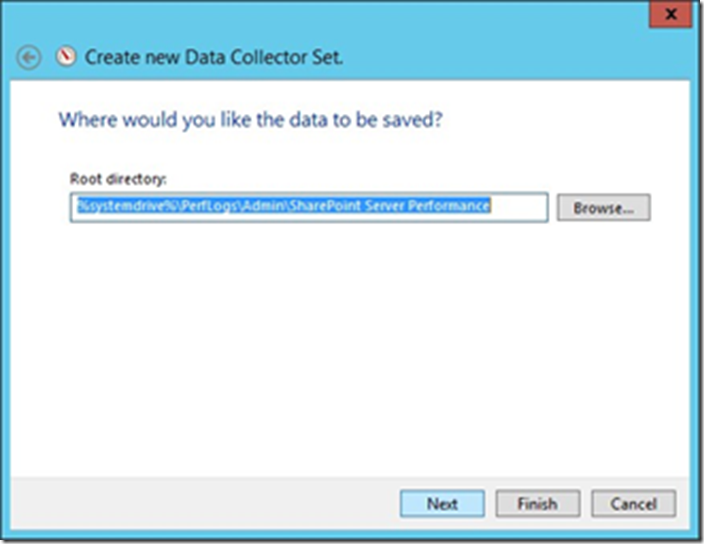
9. You can specify a particular log location. By default, they are stored beneath the %systemdrive%\Perflog directory. Click Next (see Figure 6).
FIGURE 6 Choosing the save directory.
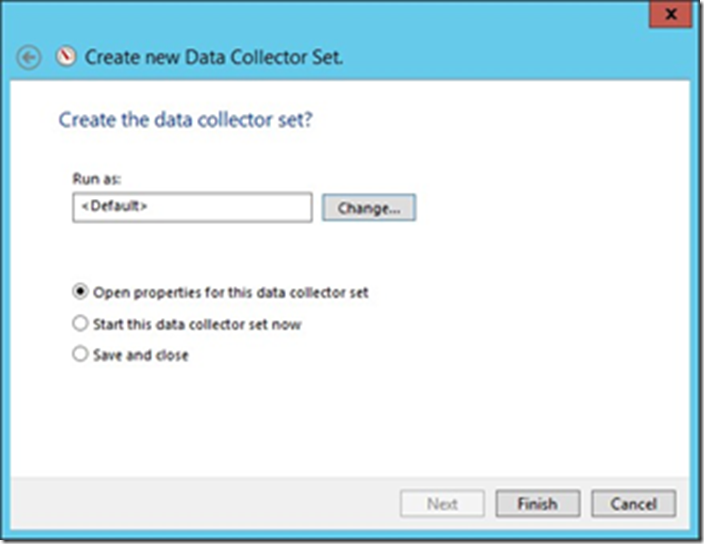
10. The final step of creating the new data collector set is to choose which account it runs under and selecting from a series of actions:
A. Open Properties For This Data Collector Set enables you to specify additional selections for your log, such as its duration.
B. Start This Data Collector Set Now saves and immediately starts the data collector set capture.
C. Save And Close (selected) saves all changes and closes the dialog box.
11. Select the Open Properties for this Data Collector Set radio button because you want to limit the duration of time that the samples are captured; then click Finish to complete this data collector set (see Figure 7).
FIGURE 7 Completed data collector set (properties selected).
12. Within the properties of the data collector set, you will define two things: when the PerfMon jobs will run and what their durations are. To choose when the jobs will be run, select the Schedule tab and click Add (see Figure 8).
FIGURE 8 Adding to the schedule.
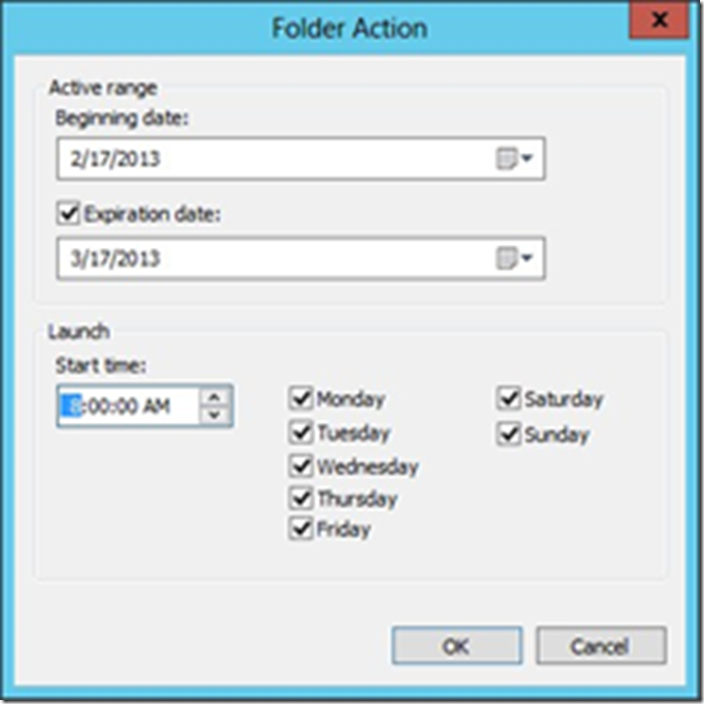
13. On the Folder Action screen, select start and stop dates for your baseline, along with the time the sample should be run and the days of the week on which it should be run. Click OK when the process is complete (see Figure 9).
FIGURE 9 First baseline schedule entry.
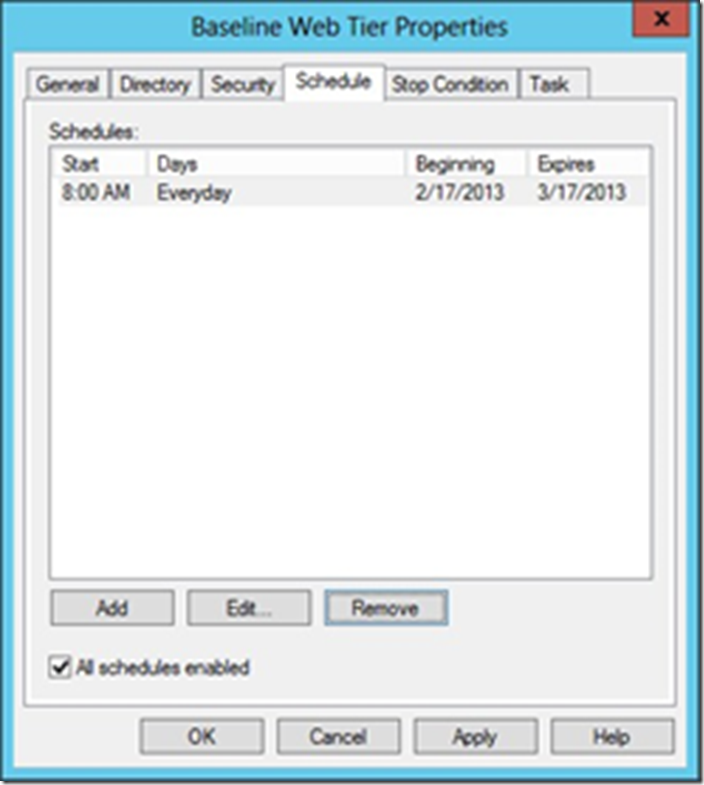
14. Repeat this process, choosing all the times when you want to monitor throughout the day (see Figure 10).
FIGURE 10 Baseline schedules.
15. Now that the schedules are built, all that remains is to set the duration of time that each captures information. On the Stop Condition tab, select the Overall Duration check box, and set the time length to 5 minutes. Click OK when complete (see Figure 11).
FIGURE 11 Stop condition.
Using a data collector set template
Now that the data collector set is defined, you can export it to a template for use with your other servers.
1. In Performance Monitor, select the collector set template and select Save Template (see Figure 12).
FIGURE 12 Saving the template
.2. By default, the templates are saved in C:\Windows\System32. If desired, choose a different location (perhaps on an available network share) and name the file before saving it (see Figure 13).
FIGURE 13 Choosing a template location.
3. Copy your template to the other server(s) you want to monitor. Open perfmon.exe on those servers and expand the Data Collector Sets icon.
4. Right-click User Defined. From the New menu, select Data Collector Set (see Figure 14).
FIGURE 14 New data collector set
5. Select a name for your data collector set (preferably the same one you had before); then select the Create From A Template (Recommended) radio button and click Next (see Figure 15).
FIGURE 15 Creating from a template.
6. On the template selection page, choose Browse (see Figure 15).
FIGURE 15 Browsing for a template.
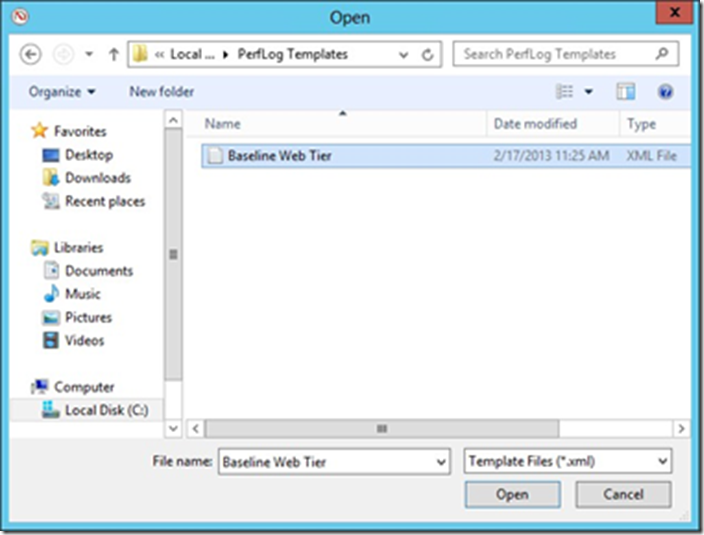
7. Select the baseline web tier template you created previously and click Open (see Figure 16).
FIGURE 16 Baseline web tier template.
8. Click Finish to complete the new data collector set (see Figure 17).
FIGURE 17 Finishing the process.
