As your SharePoint installation grows in scope, you may want to evaluate the performance of one or more servers within the farm. Examining the performance level of each server in the farm from an operating system perspective is one way to predict areas in which more system resources or configuration changes are required.
One tool that can be used for this purpose is Performance Monitor (PerfMon), a native tool installed along with Windows Server. This tool enables you to monitor and capture metrics about your individual servers using a series of performance counters.
As SharePoint, SQL, and other applications are added to a server, performance counters for those applications are made available to PerfMon. These new counters describe additional performance and health metrics that are specific to the new application or its major components.
Starting a performance monitoring capture
To start a new performance capture, begin by opening PerfMon. In Windows Server 2012, you can do this by going to your Start screen and selecting the tile for PerfMon (see Figure 1).
FIGURE 1 Performance Monitor icon.
If you are having difficulty locating this app, there is another way to start PerfMon. Simply start a search and then type perfmon into your search box and select its icon (shown in Figure 2).
FIGURE 2 Finding PerfMon using search.
When Performance Monitor appears on the screen, there isn’t a whole lot to it. To immediately begin using PerfMon, select the Performance Monitor menu item. A capture graph appears (as shown in Figure 3).
FIGURE 3 PerfMon default capture.
Still not too impressive, is it? At this point, PerfMon is capturing the %Processor Time performance counter over a 100-second (1:40 duration) interval.
adding SharePoint counters to Performance Monitor
All sorts of SharePoint-specific counters can be added to a PerfMon capture. Counters are included for SharePoint, but other subsystems counters are also represented:
- Access Services (2010 and 2013 versions)
- InfoPath Forms Services
- Microsoft Office Web Apps
- Search
- Visio Services
Adding a counter to an existing performance capture is fairly straightforward:
1. Select the plus (+) icon in the toolbar (see Figure 4).
FIGURE 4 Adding a counter.
2. Add in a new counter (see Figure 5). Scroll down to the SharePoint Foundation category, expand it, and then select the following:
A. Health Score displays the SharePoint Server Health Score
B. Current Page Requests is the number of current requests in processing
3. In the Instances Of Select Object window, select <All Instances>.
FIGURE 5 Adding SharePoint Foundation counters.
4. Select the Show Description check box in the lower-left corner and then select Add to add the counter. Finally, click OK to add the counter to Instances Of Select Object (see Figure 6).
FIGURE 6 Counters are added.
One of the most valuable pieces of information in the Add Counters window is the oftenoverlooked Show Description check box. Selecting this box shows a description of what the counter actually does within the system.
5. The new values counters appear and are captured in the graph (see Figure 7).
FIGURE 7 Performance values captured.
Building and reporting performance using a data collection set
The previous example is an ad hoc capture, meaning two things:
- Every time you start a new PerfMon session, you have to add the counters back in.
- There is no meaningful way to capture and replay the counters as they appear.
The next logical step is to build a data collector set to monitor the performance counters; then use the Reports feature of PerfMon to “replay” the log for review.
This example adds some basic performance counters used to monitor basic server performance:
1. Open Performance Monitor.
2. Within PerfMon, expand the Data Collector Sets group and select User Defined. From the New menu, right-click and select Data Collector Set (see Figure 8).
FIGURE 8 Creating a new data collector set
3. Enter a name for your new data collector set, select Create Manually (Advanced), and then click Next (see Figure 9).
FIGURE 9 Naming the data collector set.
4. Choose to capture only performance counters and click Next (see Figure 10).
FIGURE 10 Choosing to create a performance counter data log.
5. Select the Add button to choose counters (see Figure 11).
FIGURE 11 Selecting Add.
6. You will select five counters that are often used to check basic health of the server on which SharePoint is installed:
A. % Processor Time shows processor usage over time
B. Avg. Disk Queue Length shows the average number of both read and write requests that were queued for the selected disk during the sample interval
C. Available MBytes shows how much physical memory is available for allocation
D. % Used and % Used Peak Of Paging File shows the current and peak values for paging file used
7. Click OK to continue (see Figure 12).
FIGURE 12 Selected performance counters
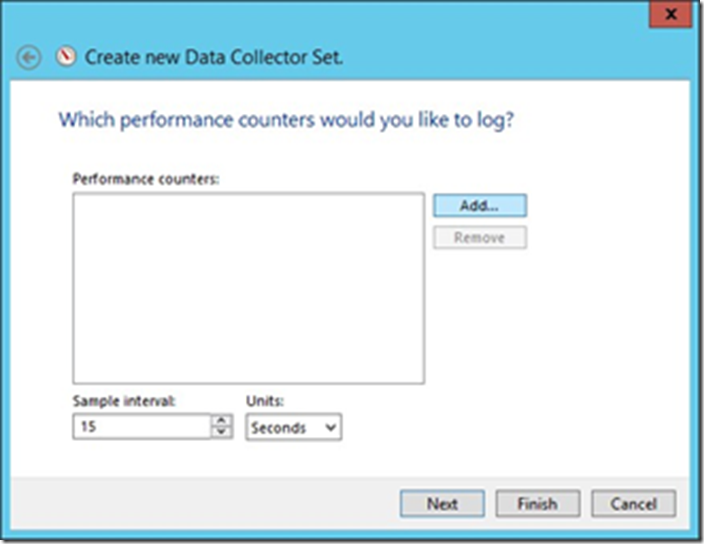
.8. The selected counters are displayed next. You might consider changing the sample interval (time between counter samples in seconds). Click Next to continue (see Figure 13).
FIGURE 13 Counters added.
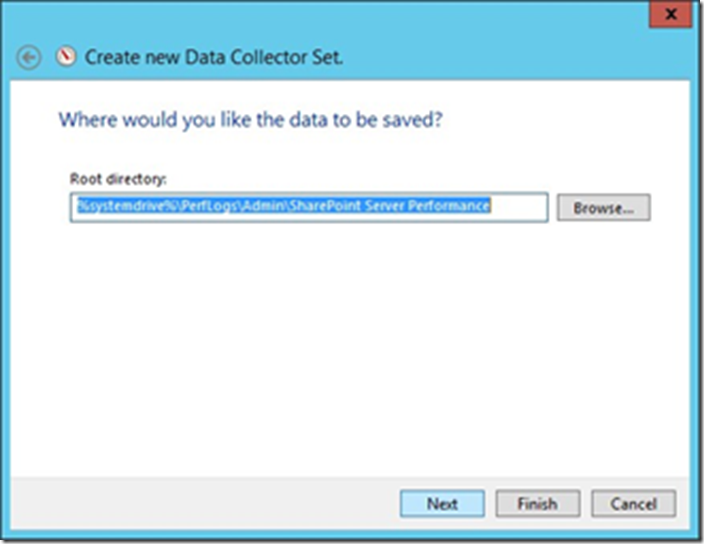
9. You can specify a particular log location.
10. By default, they are stored beneath the %systemdrive%\Perflog directory.
11. Click Next (see Figure 14).
FIGURE 14 Save directory.
12. The final step in creating the new data collector set is to choose which account it runs under and selecting from a series of actions:
A. Open Properties For This Data Collector Set enables you to specify additional selections for your log, such as its duration.
B. Start This Data Collector Set Now saves and immediately starts the data collector set capture.
C. Save And Close (selected) saves and then closes the capture.
13. Select Finish to complete this data collector set (see Figure 15).
FIGURE 15 Completed data collector set.
14. To begin the capture, simply right-click your data collector set and select Start (see Figure 16).
FIGURE 16 Start capture.
15. If you attempt to look at the report for your performance counter capture, it will show as Collecting Data until you stop the process (see Figure 17).
FIGURE 17 Capture in progress; report not available.
16. After about 5 minutes, you should have a fairly good capture, but you could extend this duration if you want. After you capture enough data, select Stop (see Figure 18).
FIGURE 18 Stopping a performance capture
17. Selecting a report displays the metrics for a given time period along with some maximum, minimum, and average values (see Figure 19).
FIGURE 19 Performance Monitor report.


